

AI-powered cost intelligence and benchmarking
Built on data. Interpreted by experts.
As part of our national Quantity Surveying offering, Quin combines specialist advice, national project cost data and AI-powered benchmarking to help you understand how your costs compare with similar projects, what drives any differences and where to focus your attention.
Understand your costs and what drives them
Benchmark against a growing base of national project evidence
Each cost plan or estimate we deliver contributes to a live benchmark library. Compare costs per square metre, per function and across individual elements and trades using relevant projects, sectors, procurement routes and locations.
Account for location and escalation
Benchmarks are adjusted for location and current conditions and forecast forward to explore escalation options. Compare costs on a consistent basis and understand how timing and location affect your budget.
Identify costs that need closer attention
Explore variances across preliminaries, trades, contingency levels, professional fees, furniture, fittings and equipment (FFE), information and communications technology (ICT), and client costs as required. Rates outside expected benchmark ranges are flagged for review and incorporated into cost advice.
Make informed choices earlier
Test assumptions against comparable project evidence while there is more opportunity to influence scope, design, budget, schedule and procurement.
Understand the evidence behind your advice
See the benchmark data, escalation trends and market movements supporting our recommendations, helping you explain decisions to stakeholders and auditors.
See how your cost plan compares
Start with the overall project cost, explore the elements behind it, then examine a specific element in more detail. These education project examples show how the comparisons build a clearer picture of your budget.
1. Compare the overall project rate
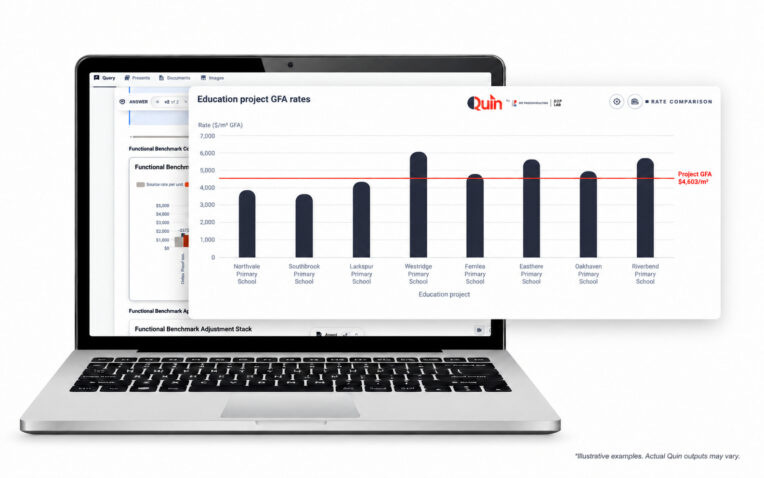
See where your cost plan sits against similar projects by comparing cost per square metre of gross floor area (GFA). Here, the red line shows the current plan at $4,600/m² GFA. Comparing this with other education projects provides a starting point for understanding the overall allowance before examining individual elements.
2. Review the cost range for each element
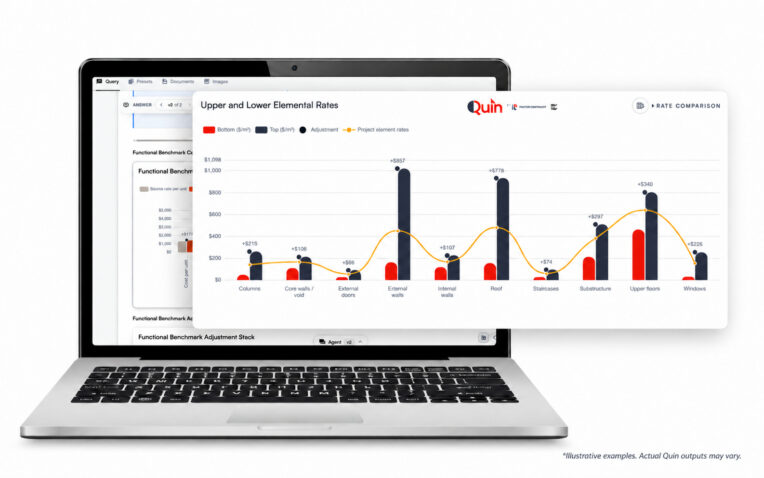
Look beyond the overall rate to see how your allowances compare across individual building elements. The lower and upper benchmark rates provide context, while the orange line shows the current cost plan. This helps our Quantity Surveyors identify differences worth exploring and assess whether they reflect your project’s design, scope and requirements.
3. Examine a specific element in more detail
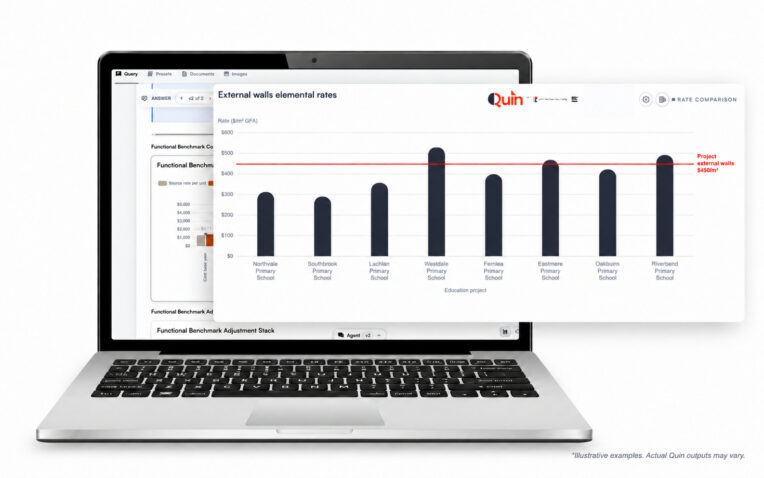
Focus on an element such as external walls to understand how its allowance compares across similar projects. Here, the red line shows the current external walls allowance of $450/m² GFA. Our Quantity Surveyors consider the façade design, materials and performance requirements to explain differences and advise whether further review is needed.
Specialist advice for your project
Quin draws on 60+ years of project data and verified Australian project evidence. Our Quantity Surveyors interpret the comparisons against your project’s scope, scale, quality and delivery requirements, turning analysis into practical advice from the early business case through to project completion. A difference from a benchmark is a starting point for review, rather than a conclusion about whether a cost is appropriate.
Bring greater clarity to your next project’s costs
For a copy of the brochure or to discuss your project, email our team here